Recommended
A guide to debugging your code
In IT and software development, there are terms with distinct meanings that are still often used interchangeably, causing confusion.
This is particularly true for the terms troubleshooting and debugging.
They both refer to a process of identifying, isolating, and fixing issues.
But they have different meanings and connotations, which can lead to misunderstandings when discussing these topics.
That’s why we’ll dive into these two processes, compare them, and examine how they differ so that you can use them correctly.
Table of Contents
At some point, every app or system will break down or exhibit some other undesirable behavior.
This can be attributed to various factors, such as poor infrastructure and architecture, malfunctioning third-party services, or faulty pipelines, permissions, and networks.
After such incidents, it’s necessary to investigate what went wrong and why.
In other words, troubleshooting must be performed.
Despite its widespread usage, the term troubleshooting is often confused with debugging, as we already mentioned in the introduction.
However, the definition from Wikipedia should set the record straight:
Troubleshooting is a form of problem solving, often applied to repair failed products or processes on a machine or a system. It is a logical, systematic search for the source of a problem in order to solve it, and make the product or process operational again.
As the explanation suggests, the emphasis in troubleshooting is on identifying the core cause of an issue and establishing the most effective method to restore system functionality.
This means that it looks at the problems in a larger context than debugging does.
To accomplish this, troubleshooters typically follow a multi-step approach similar to the one represented in the image below.
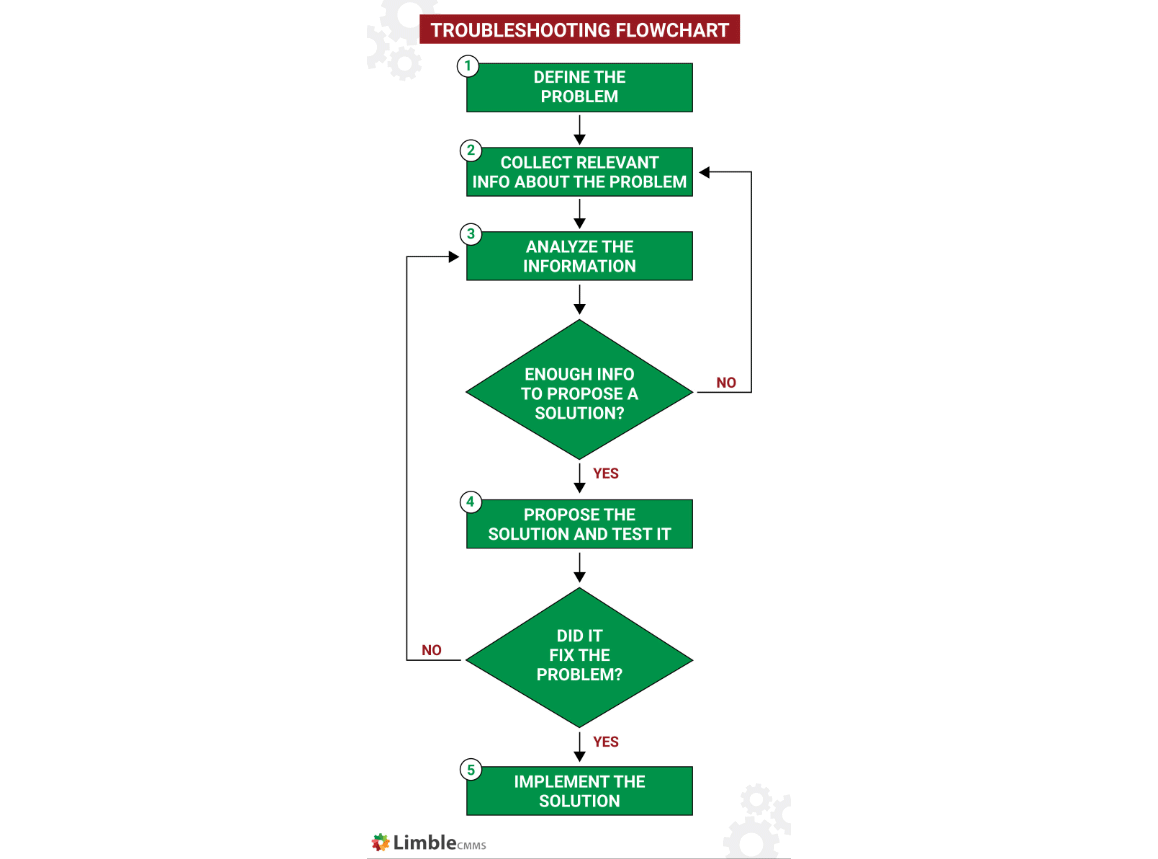
The initial step entails isolating the issue and identifying the scope of its impact.
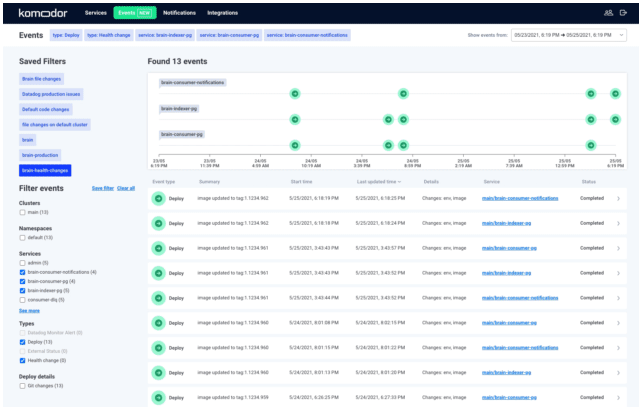
This typically begins with a strategic assessment of the entire system, during which diagnostic tools such as Komodor, displayed below, can be utilized to determine what went awry.
The next step involves collecting relevant data related to the issue, which may include checking the app’s manual, maintenance history, issue reports, and so on.
The collected data is then evaluated to rule out possible causes one by one and zero in on the root cause.
After examining all of the facts and conclusions, you should have more than enough data to suggest a solution and implement it.

Get unreal data to fix real issues in your app & web.
It’s important to note that while a flawed system may have minor consequences, it could also result in security breaches and have an impact on the company’s bottom line.
Therefore, troubleshooting should be conducted frequently, not simply when a user reports an issue.
Debugging, in contrast to troubleshooting, is a more specific process that primarily focuses on locating bugs, crashes, and other defects in code and removing them from the application.
Developers typically carry out this process after QA specialists have found and reported a bug or as standard procedure when coding.
However, although debugging may have a narrower focus than troubleshooting, that doesn’t necessarily mean that it’s less challenging.
A Quora user sheds some light on the subject below:
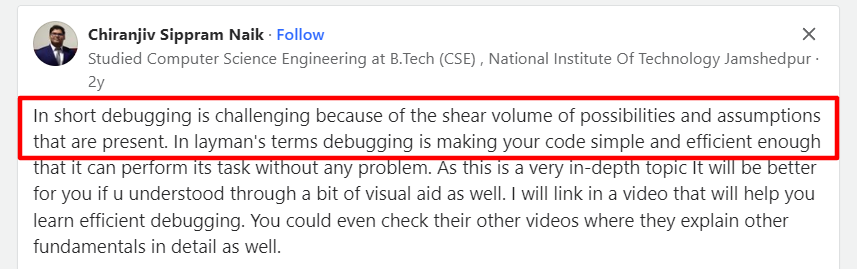
Debugging is an investigative process that requires you to examine the code in great detail, rule out different possibilities and assumptions, and discover why it’s malfunctioning so that the bug can be removed.
The process typically involves six steps, as you can see in the image below.
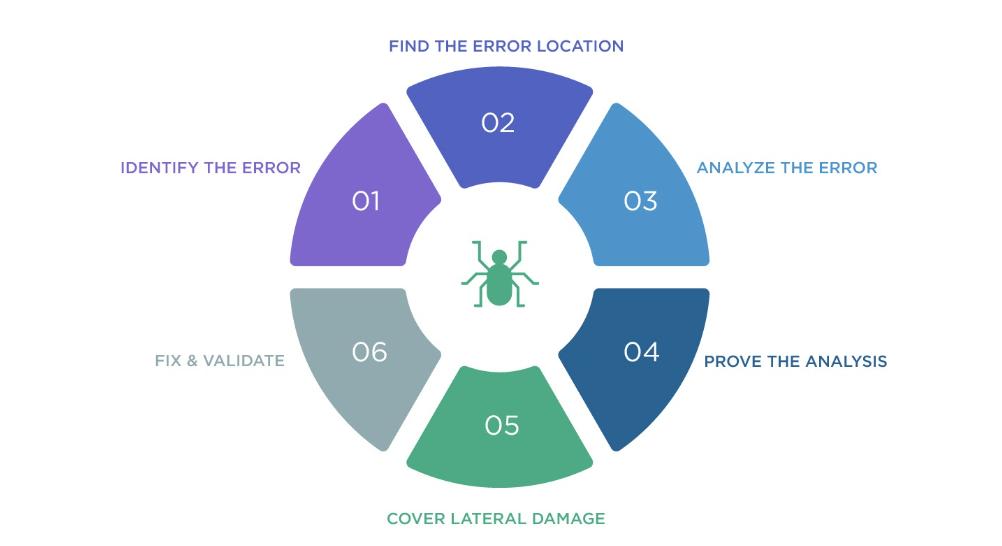
In other words, to fix a bug, it’s not only pivotal to discover and analyze the error but also to ensure that the patch doesn’t cause lateral damage to other components of the application and that all parts of the code are effectively integrated.
To achieve this, you can employ two equally effective types of debugging: reactive and preemptive.
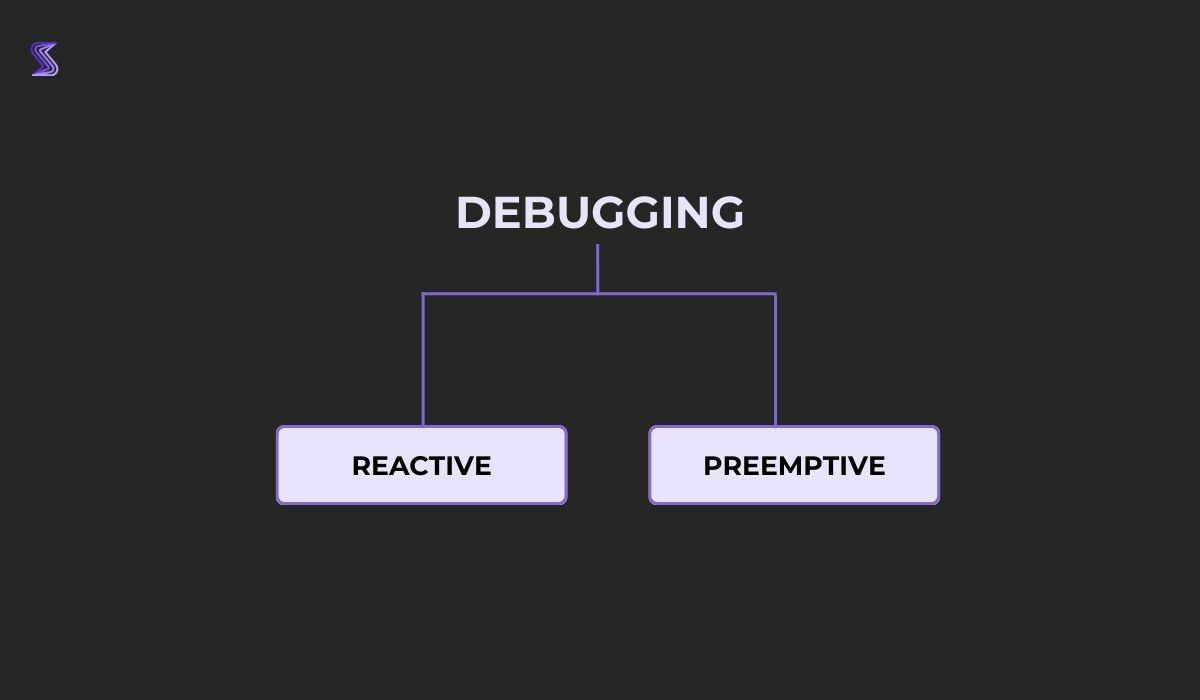
Reactive debugging is primarily focused on addressing bugs that have been identified during testing.
After receiving a bug report from QA experts, developers respond to the report and work to resolve the issue.
In contrast, preemptive debugging takes a preventive approach and seeks to mitigate issues before they occur.
This type of debugging focuses on problematic areas during app development and tries to eliminate them through code reviews and static code analysis.
All in all, debugging takes place throughout the entire app development process and is one of the foundations of quality and functional code.
Although troubleshooting and debugging are two related processes, there are also significant differences between them.
Troubleshooting, for example, is a process that encompasses looking at the entire system to find gaps in functionality and performance and rectifying them.
It’s done at the macro level, meaning that you’re considering all the components that make up a system.
That means that you’ll handle the following aspects:
It also often necessitates going beyond technical information and communicating with end-users of the system in order to better understand their problems.
Debugging, on the other hand, is a narrower, more specialized process that can be considered a subcategory of troubleshooting.
While troubleshooting is concerned with solving large-scale, system problems, debugging focuses on fixing bugs, crashes, glitches, and other anomalies in the code.
To debug code, developers must be familiar with the programming language and environment being used, which is less important when troubleshooting.
Ideally, debugging should be done in a single session during which the problem is identified, and can involve techniques such as backtracking, cause elimination, rubber duck debugging, and pair debugging.
You can also use tools such as our own Shake to alleviate the debugging process.
Although Shake is not a debugger per se but rather a bug and crash reporting tool, it can come in particularly handy when you want to track down a bug.
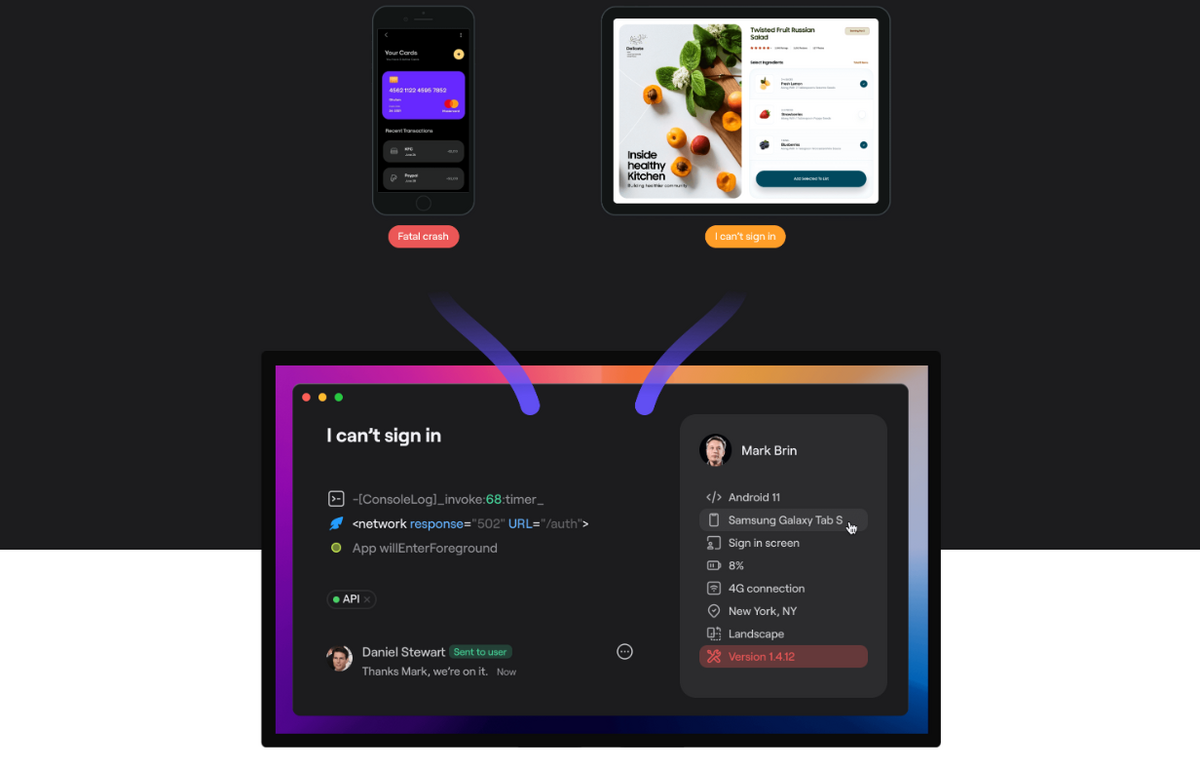
As an SDK, it can be installed on any iOS or Android device with only a few lines of code, and you can trigger it by shaking the phone whenever you find a bug in your app.
It’ll then generate a comprehensive bug report containing more than 70 crucial pieces of environmental data that will make detecting bugs in the code significantly easier.
Some of the information that Shake automatically captures includes device information, memory usage, network data, CPU usage, and history logs, to name just a few, but it can be customized if you need more details.
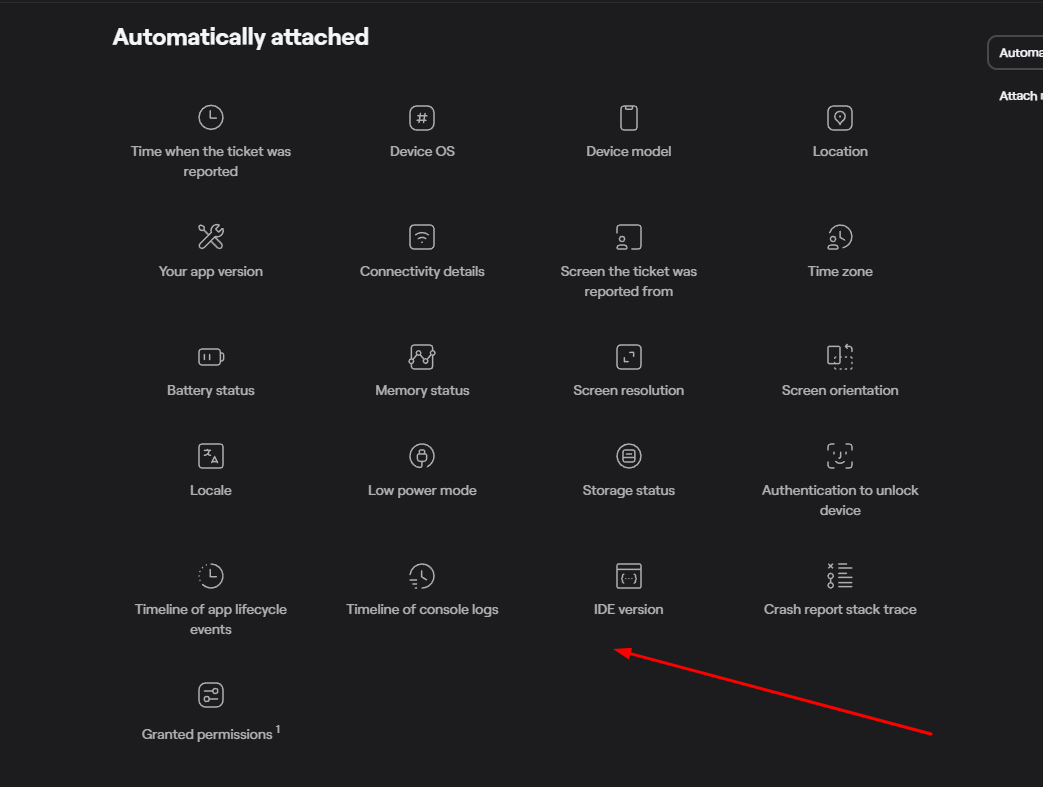
This can be of immense help to developers during debugging.
Ultimately, the distinction between troubleshooting and debugging comes down to scope.
Troubleshooting involves a broader process of identifying the underlying cause of a problem as compared to debugging, which focuses on fixing bugs.
By understanding the differences between these two processes, you can better determine which approach to take when solving problems with your code or system.
Debugging and troubleshooting go hand in hand because they both aim for the same goal—finding and fixing issues in an app.
This is why there are some practices that can be applied to both processes and used in either one. The following three sections contain the most important ones of these.
During troubleshooting and debugging, it’s best to inspect the changes first.
This means looking at what changed, when it changed, and where it changed, as this can be useful in your quest for errors and inconsistencies in the system.
This isn’t as simple as it may appear because it can depend on numerous variables, tools, programming languages, and systems you employ.
Despite the complexity of the task, you can begin by investigating your logs and version control to ascertain whether a change is the root cause of your problem.
Fortunately, there are top-notch logging tools available, including Papertrail, DataDog, and Cloudlytics, that enable you to not only inspect log changes but also alert you when performance errors occur.
For example, DataDog has a user-friendly interface that allows you to scrutinize the logs thoroughly, pinpoint changes, and determine if they’re the potential cause of the error.
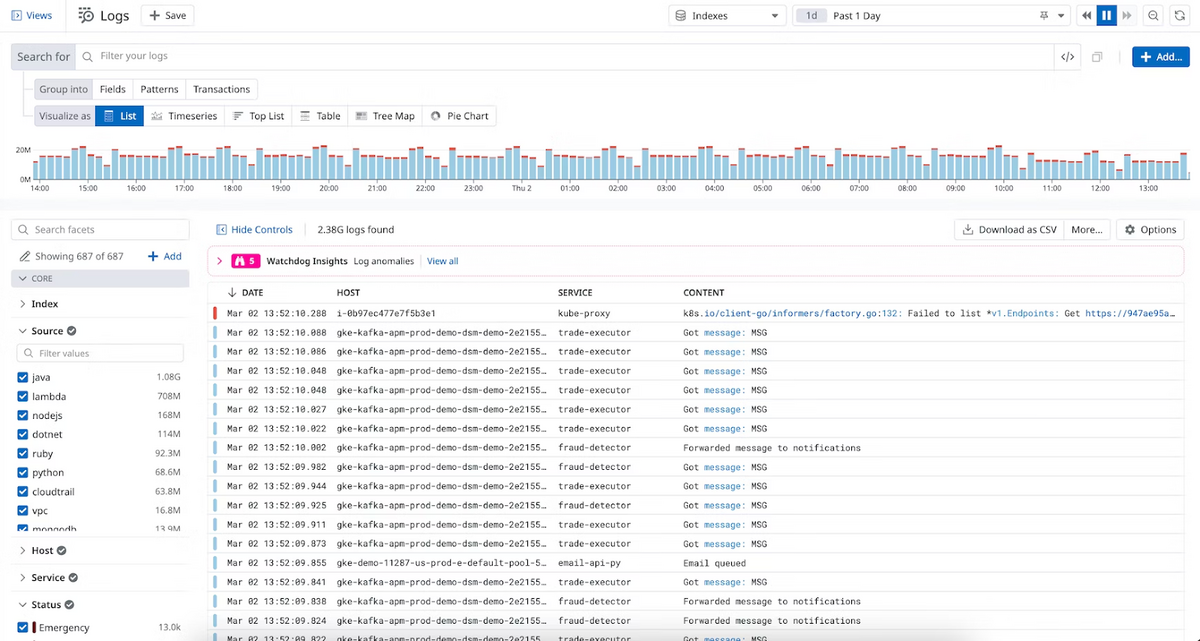
You must admit, this expedites the whole troubleshooting and debugging process and helps you prevent errors from creeping into the system.
Another technique you can deploy here is to inspect your version control system because most of them give you access to the history of changes in the file or repository.
For instance, in Git you can use the git log command to see what changes were made between the two commits.
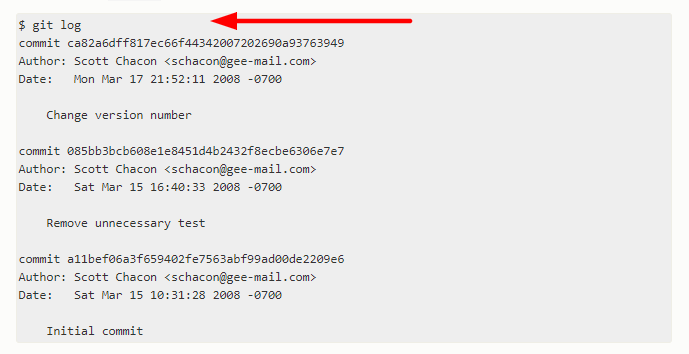
The git log command will then list the commits in a repository, with the most recent commit appearing first.
In general, checking for changes can be a valuable technique for detecting errors and inconsistencies in your code or system.
From there, you can move on to other practices.
Although tools are useful, keep in mind that they can only detect problems that are caused by factors within the system.
They cannot identify faults in a process that stem from outside elements, so they may not reveal important defects.
In that case, manually inspecting the app for malfunctions can be a great addition to your automated processes.
There are several situations when using tools alone isn’t sufficient:

Very handy for handling user feedback. CTOs, devs, testers – rejoice.
These are just a few circumstances in which identifying a problem requires more than simply using tools.
However, in cases where automated tools aren’t applicable, it’s still worth using them as part of a process for identifying problems.
But it would help if you also used human judgment combined with these results to verify and ensure that nothing was overlooked.
Bug tracking tools are essential at every stage of the troubleshooting and debugging process.
It’s paramount to know what defects have been reported, who has worked on them, and whether each error is still an issue or has already been resolved.
A good bug tracking tool can help you keep tabs on all that information by providing you with a central location for organizing issues in one place.
There are many excellent bug-tracking tools available on the market today. Some of the most widely adopted ones include:
We’ll use Jira as our example since it’s widely used among developers and has a built-in bug-tracking system.
In fact, when Jira was originally built, it was intended to be used as a bug-tracking tool, and its many features reflect that intention.
As illustrated below, Jira’s dashboard gives you an overview of the current status of your projects, with a complete list of issues, their status, and their types.
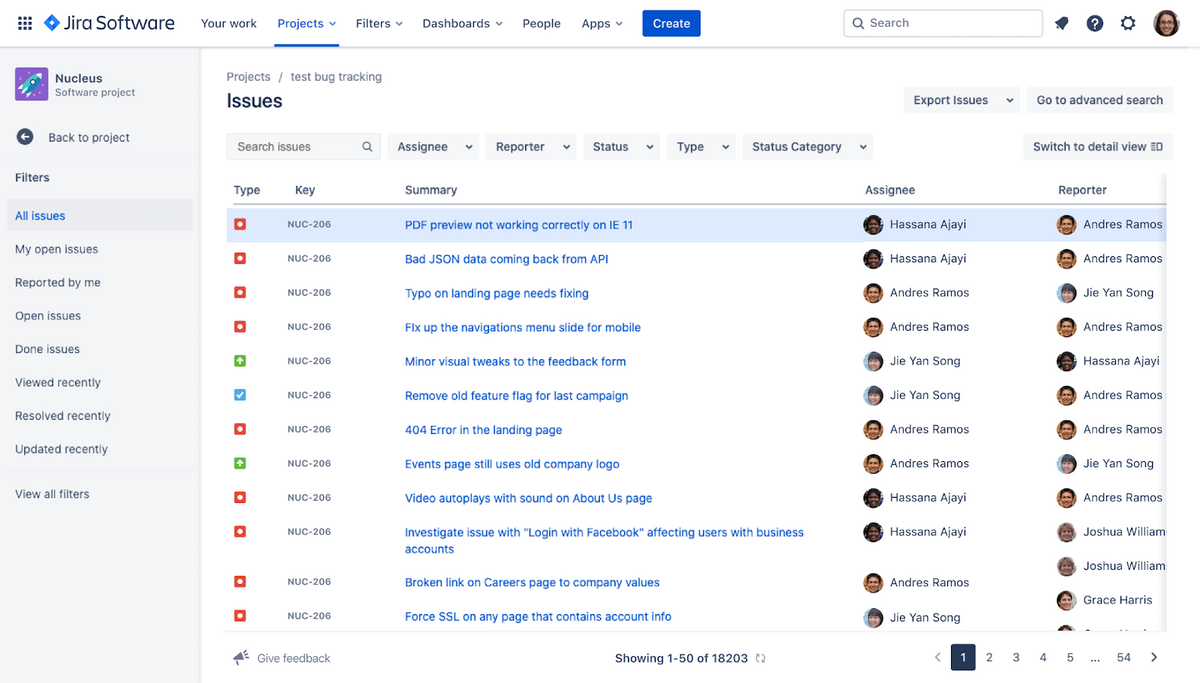
The interface also has a section where you can assign tasks to your team members, create new projects and subprojects, and perform other tasks related to bug tracking.
The tool also comes with a number of integrations, which streamline its use.
For example, you can integrate Jira with bug and crash reporting tools such as Shake.
.
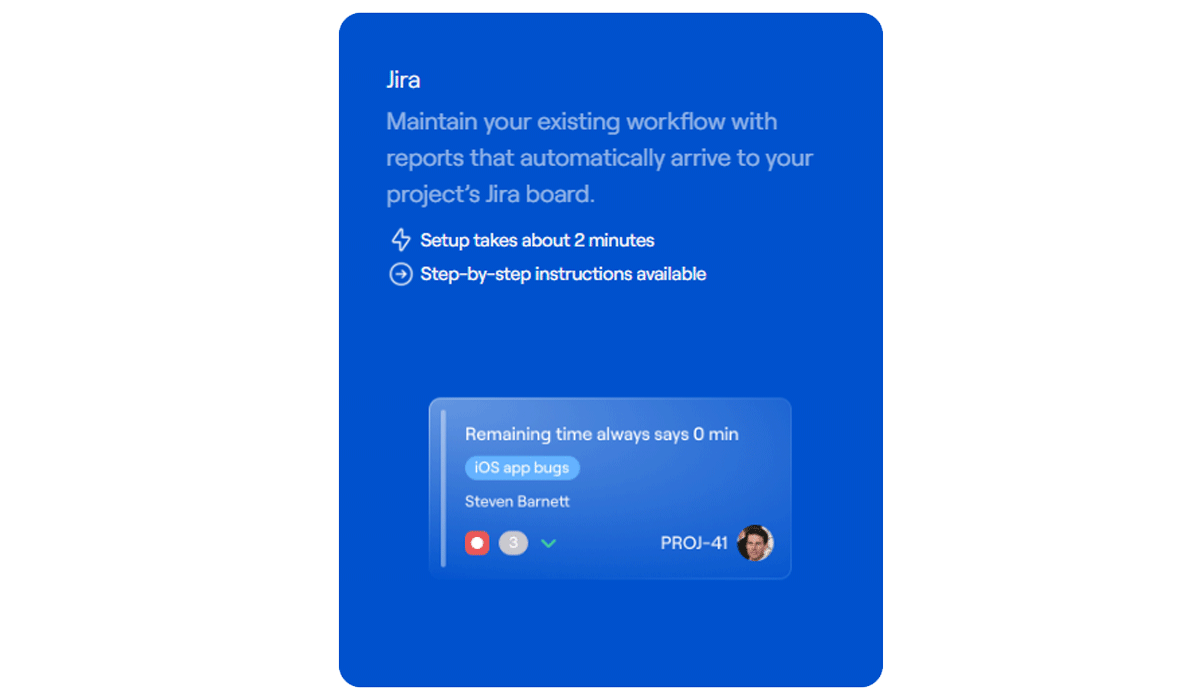
That way, when users report the bug, Shake will automatically send the generated bug report straight to Jira’s dashboard, where all stakeholders will be able to inspect it, analyze it, and track it through its life cycle.
This will make troubleshooting and debugging even more streamlined because it brings everything under one roof.
Troubleshooting and debugging are two closely related practices that help identify and fix issues in applications.
While troubleshooting is generally used to identify issues that occur at the system level, debugging is performed to find bugs in code.
It’s important to note that these practices are often utilized together in order to detect and resolve issues, so it’s important for developers of all skill levels to develop proficiency in both of them.
From internal bug reporting to production and customer support, our all-in-one SDK gets you all the right clues to fix issues in your mobile app and website.
We love to think it makes CTOs life easier, QA tester’s reports better and dev’s coding faster. If you agree that user feedback is key – Shake is your door lock.
Read more about us here.

Add to app in minutes

Doesn’t affect app speed

GDPR & CCPA compliant

Unexpected things pop up
Just like bugs in your app or web 🐛 Fix them now with just one reporting tool.