
Application logs are one of those software development SOPs that many teams do just for the sake of it.
However, it’s safe to say that only a handful maximize logs to their full potential. Others simply use it to fix a bug when it occurs.
But application logs are more than just troubleshooting tools. When used properly and proactively, it can be one of the most powerful tools in a QA engineer’s toolkit.
Here are some ways your team can use application logs to improve your development projects.
Table of Contents
Design new and improved test scenarios
Application logs can be a great way to improve your test scripts and scenarios.
By analyzing them, you can determine areas of your app that you’ve neglected previously. Thus, you can account for these blind spots when planning for future test scenarios.
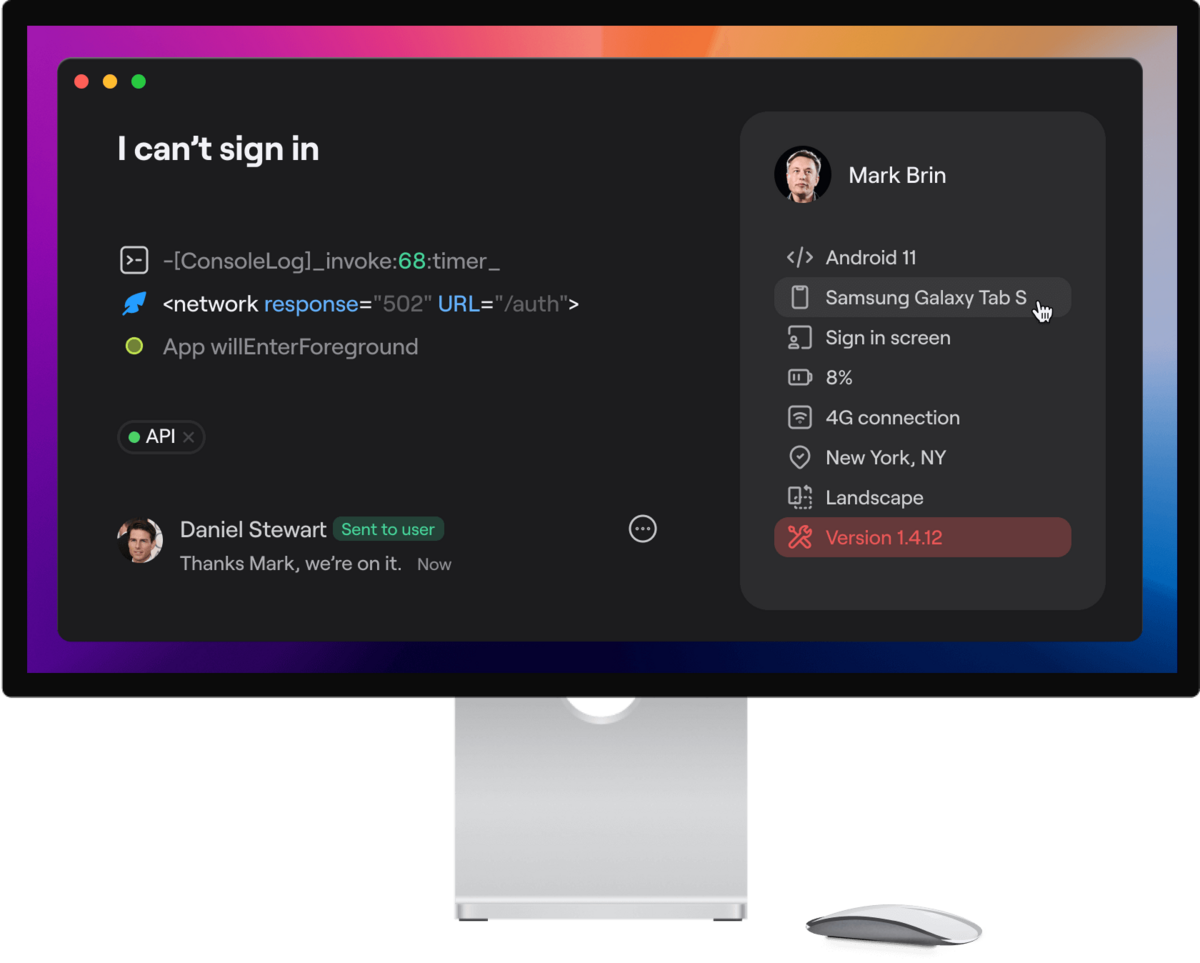
For example, let’s say you’ve encountered a bug that only happens with Samsung Galaxy smartphones.
It could mean that you didn’t account for that specific device during your test cases, in which case the incident will prompt you to write new scenarios for it in the future.

Get unreal data to fix real issues in your app & web.
Continuous improvement using application logs is arguably smarter than trying for 100% test coverage.
That’s because achieving full test coverage is impractical and expensive, especially for complex projects. If you do this, you might waste time testing code that doesn’t actually need testing.
It’s why many companies like Microsoft recognize that the optimal coverage rate is between 70%-80%.
But how about the potential bugs in the remaining 30%-20% of your code? Reviewing your application logs is a great way to catch them.
The bottom line is that application logs are powerful tools that tell you how effective your current test routine is. More importantly, it tells you which aspects to focus on so you can improve it.
Identify the root cause of issues quickly
Perhaps the classic purpose of application logs is to help development teams fix bugs faster.
The truth is that most teams struggle with this. Our experience shows that the majority spend 80% of their time just trying to find the source of the bug rather than fixing it.
This is where application logs come in.
A good application log will include relevant information regarding the error, such as the code section that triggered it or the device the app was running on. This tells QA engineers exactly what went wrong and helps them pinpoint the root cause of the issue quickly.
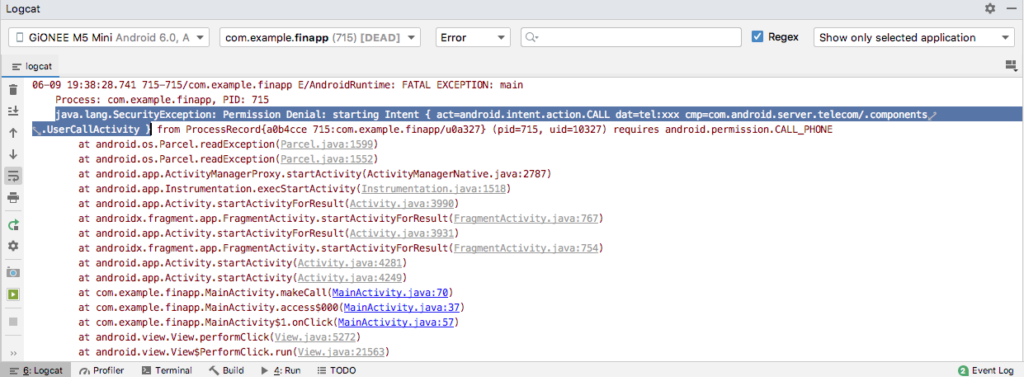
But for this to work, your application logs must include all the necessary data. This isn’t always the case, even with default logs generated by Android or iOS.
That’s why using bug and crash reporting tools like Shake is beneficial.
When an error occurs, Shake automatically appends all the relevant data with minimal effort on the developers’ part. That’s because they don’t need to manually code the parameters they want to include in the log—Shake does this for them.
Here are some of the parameters included by default with each report:
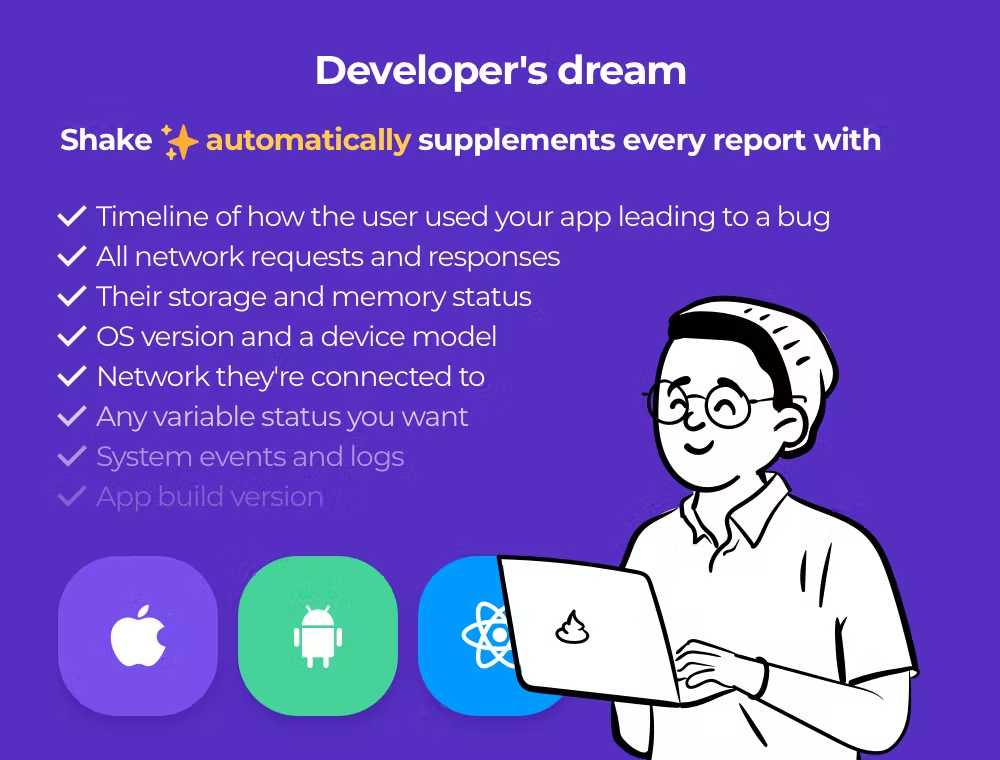
Reports in Shake are also customizable. You can quickly add any variable or parameter from the dashboard without touching the code.
But whether you use Shake or manual reporting, application logs are an essential debugging tool. They can help QA teams reproduce and repair issues more quickly and easily.
Facilitate pattern recognition and correlation
Application logs are more than just corrective tools that you only consult when an error occurs. They can also be a preventive measure that helps prevent future issues from happening.
QA engineers can detect issues by looking for patterns and correlations from one or multiple application logs.
The reality is that application logs aren’t always clear and straightforward.
Most software ecosystems are complex. When a system-wide error occurs, every part of the chain, from the mobile app to servers, generates logs. In this scenario, determining the cause of the error can be challenging.
The best approach is to look for connections and hidden clues in these logs. Eventually, anomalies will emerge that indicate where the problem is.

Once you’ve detected an anomalous pattern, you can set your system to detect it in the future. That way, when the error happens again, you can uncover and repair it more quickly.
Pattern recognition and correlation are tricky processes that often require complex algorithms or machine learning. Thus, we won’t be delving into them in this article.
But the point here is that application logs can be a rich source of information if you know how to uncover them.
Monitor security and identify any breaches
Application logs are an often underused tool in mobile app security.
Because logs keep track of all activity within an application, QA engineers can use them to monitor security compliance and detect breaches as they happen. This can help better software security.
For instance, if you notice a user trying to access unauthorized files right after they change their access privileges, that’s a red flag. It could mean they’re attempting a data breach.
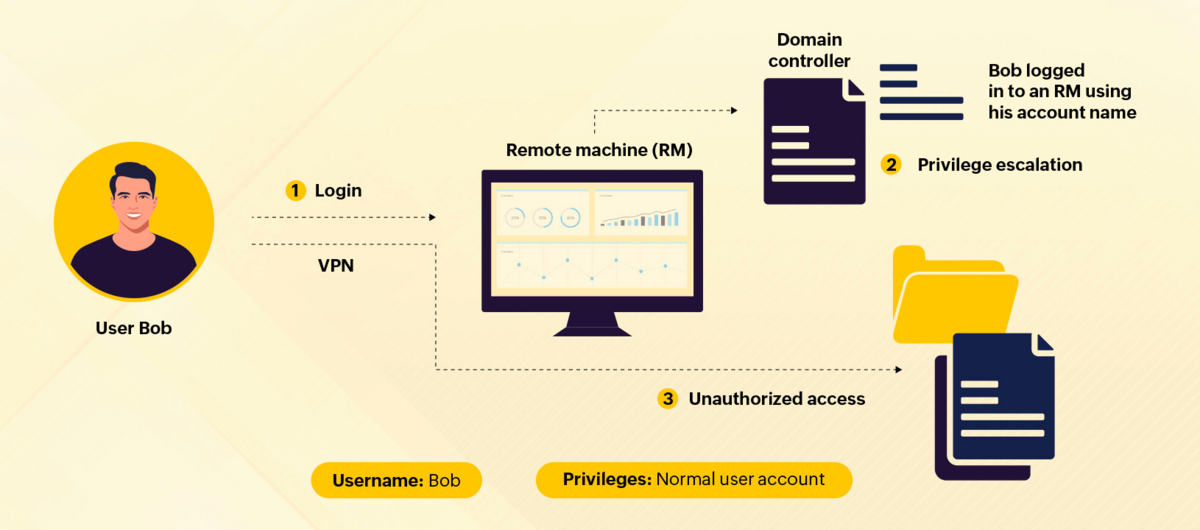
Security logs also present critical evidence when a cybersecurity attack has occurred. The data can help you recover files, limit any damage, or prevent such a breach from happening again.
For instance, many cybersecurity events are stored in threat logs, which give a snapshot of the system at the time of the attack. It tells you the IP of the hacker, which you can use to investigate the attack or block it to prevent future incidents.
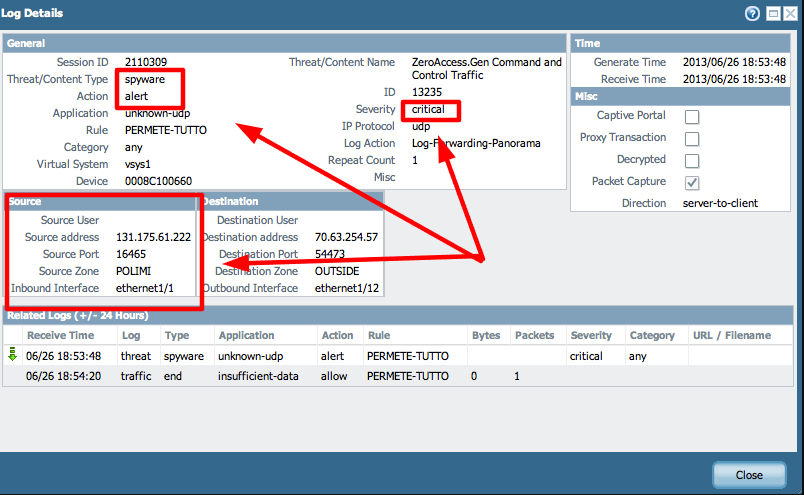
You can also use logs to detect signs of application abuse, such as continuously entering invalid inputs. This could be a way of breaking your app to expose vulnerabilities.
The bottom line is that application logs are one of the most important cybersecurity support tools at your disposal.
Observe and understand user behavior
As we mentioned above, application logs aren’t just for troubleshooting. They could also be an untapped gold mine of user insights.
The reality is that users are unpredictable. No matter how much market research teams do, people are bound to do things with your app that they didn’t anticipate.
The best course is to observe user behavior with application logs.
Application logs can give you clues on how someone is using the app. It can tell you what feature they frequently use, how often they use your application, and even on which device.
All this information can help you form a picture of your ideal users’ behavior, which you can use to optimize your app.
Application logs can also alert you to any performance dips in your app.
For instance, mobile banking apps are meant to be accessed frequently but in shorter periods. If you notice that many users spend hours using it, it may signal an underlying problem.
Or, if you notice that users are going through too many screens to reach their destination, it might indicate an inefficient navigation scheme.
So, we advise not to limit application logs only when fixing problems. Instead, it would be best to maximize them as a research tool, too.
Create and maintain a reliable audit trail
Application logs are useful audit tools.
That’s because they record all changes and actions done on the app over time, such as creating, updating, and deleting data. This provides a reliable audit trail for QA engineers.
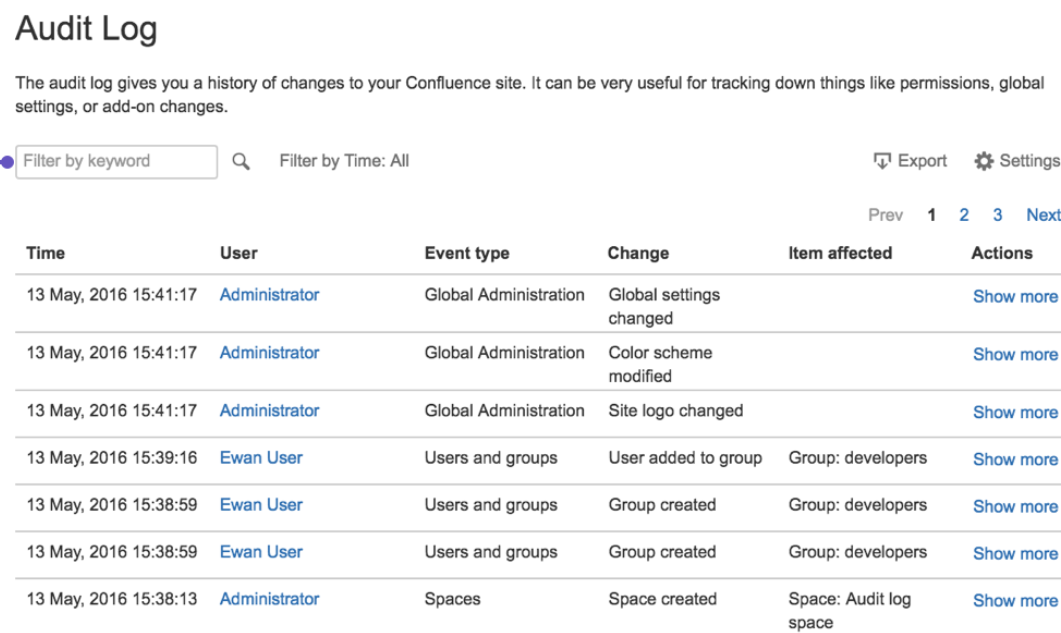
Having an audit trail is useful for several reasons.
Chiefly, it’s used as an investigation tool. When your app encounters a crash or data breach, you can use the logs to view changes to the data prior to the incident. It could lead you to the source of the error.
In some cases, you can even reverse the damage done to the data, or at least replace it with a backup.
Audit logs can also help you become compliant. It can help prove that your team is following data privacy procedures or that your app is protected enough to comply with regulatory standards.
Track the improvement of QA over time
Application logs can also be a reflection of your development team’s performance. By tracking certain metrics in the log, you can determine if your team is improving over time.
For example, one key QA metric is the mean time between failures or MTBF.
MTBF measures the average period between failures. A high MTBF is desirable, as it means your app goes on longer without encountering any crashes.
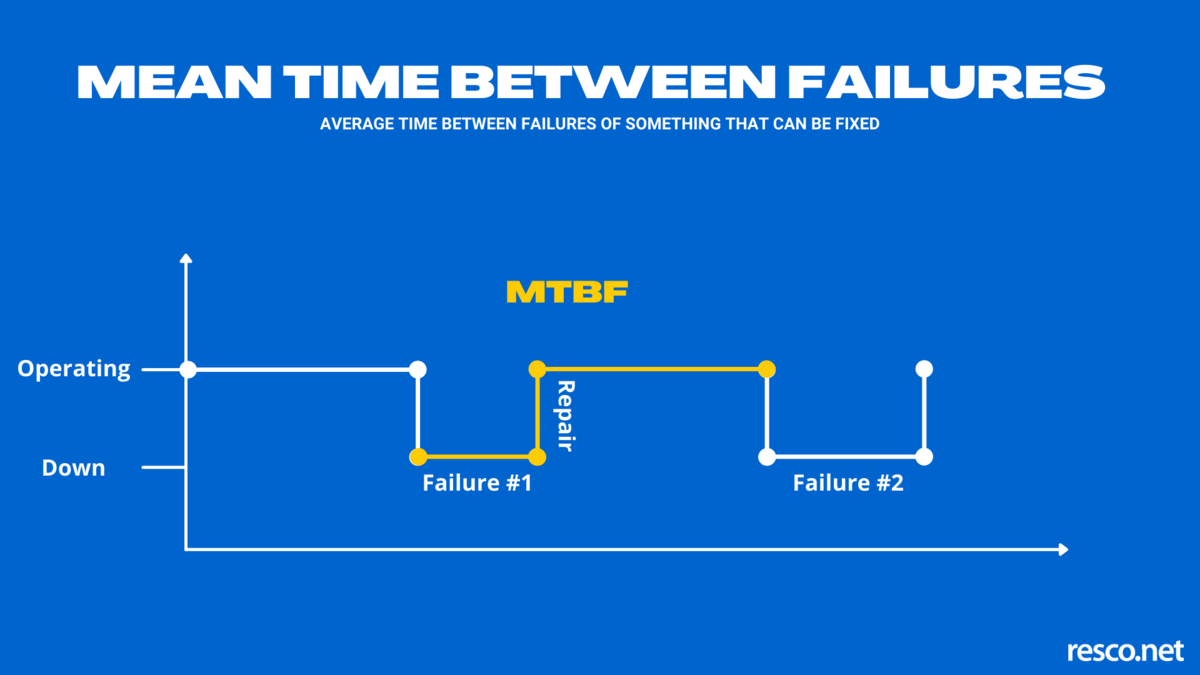
You can track your MTBF by looking at your application log and marking the timestamps when errors occur. If they happen less frequently, then your team’s QA is improving.
Another metric is the mean time to recover (MTTR), which measures how fast your team can fix errors. You can compute it by counting the total crashes reported in your application log and then dividing your total downtime by that number.

Very handy for handling user feedback. CTOs, devs, testers – rejoice.
That’s just the beginning. You can determine which metric means the most for your team’s productivity, and chances are that an application log can help you measure that.
How to simplify your application logs
We hope you’ve seen how powerful application logs can be. From researching user behavior to keeping your apps safe, they can provide tremendous benefits if used right.
However, you can only reap the rewards if your application logs are comprehensive enough. Ensuring this could be a big challenge for developers.
Fortunately, Shake can simplify this process. By automating bug and crash reporting, you can get the most useful log metrics with minimal effort and decision-making on the developers’ part.
Try Shake for free today and see how it can streamline your testing workflow.


