Debugging certainly isn’t the favorite task of most developers, but it’s one of the most important ones.
When there is an error in the code, finding and fixing it can be time-consuming and tedious.
However, there are modern methods of debugging that can make that job easier. One of them is remote debugging, and the other is live debugging.
In some ways, they are similar; in others, they are very different. In this article, we’ll examine those similarities and differences and help you decide which approach is the best for you and your needs.
Let’s start with exploring what remote debugging is.
Table of Contents
What is remote debugging
No matter how experienced and skillful your developers are, there will always be errors in the code. Therefore, avoiding those errors isn’t as important as quickly fixing them when they occur.
Debugging is crucial for that purpose. During debugging, developers comb through the code and test various parts of it to find where the problem is, what causes it, and how to fix it.
And while that sounds simple and reasonable, what happens when the developer is in one place and the bug is in an application that’s running on a system in a different location?
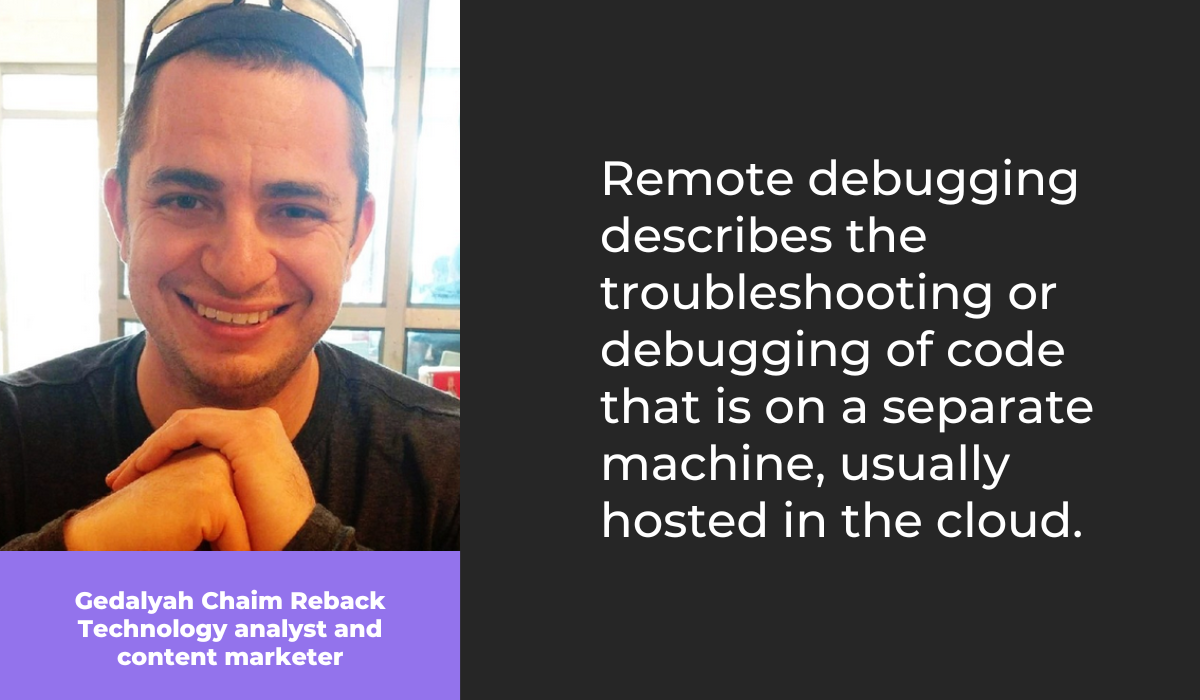
That’s where remote debugging comes in. Here’s how Gedalyah Chaim Reback, a technological analyst and content marketer, explains what remote debugging is:
If you are in any way a part of the software development world, the possibility of remote debugging shouldn’t surprise you.
Just as you can do essentially anything related to software development remotely, including writing code, communicating with team members, or writing documentation, you can also debug code.

Get unreal data to fix real issues in your app & web.
There are occasions when that’s the only viable option.
For example, as the Quora user below points out, if the alternative is to travel to the place where the machine which runs a buggy code is and fix it there, remote debugging is a much faster and cheaper solution.

Therefore, remote debugging allows you to fix code issues from anywhere in the world, provided you have the necessary tools, network connection, and permission to access the remote system.
Essentially, the way it works is straightforward.
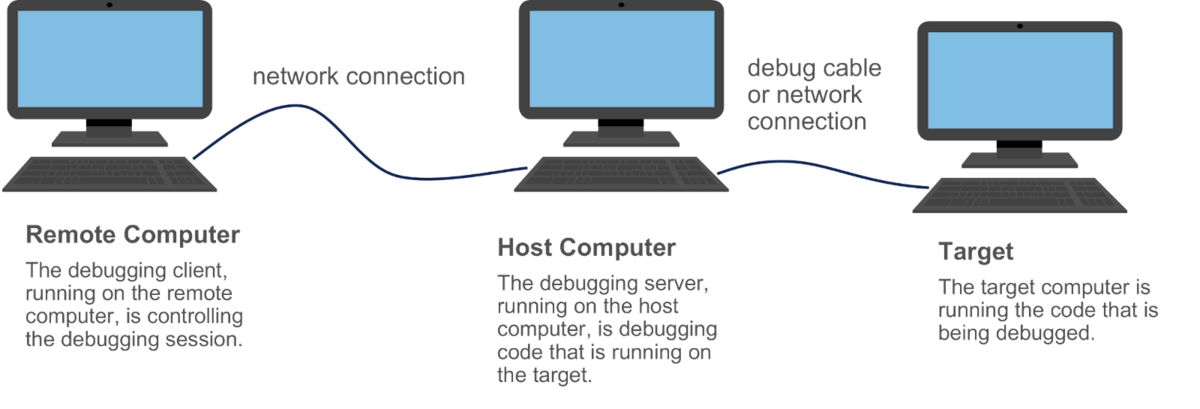
You control the debugging session from one machine, while the host computer is running the debugging server, and the code that needs to be fixed is running on the target computer.
You can see a more detailed representation of the process below.
In the following sections, we’ll dive deeper into the specifics of remote debugging and the nuances of that debugging method.
For now, you should know that it can be a very helpful way to deal with the issues in the code in a convenient and swift manner.

What is live debugging
Live debugging is a form of remote debugging, but it has certain specific elements that make it a unique solution worth examining on its own.
Primarily, live debugging is an excellent solution to a particular challenge that can arise during a debugging process that can impede the results of your bug-fixing efforts.
That situation happens when you use a debugger, which many developers regularly use as a convenient software tool for handling issues with code.
A debugger stops an app and puts it into debug mode.
Although that’s necessary for a tool to work as intended, it also means that the app which needs to be debugged isn’t running in its natural environment and behaving as usual.
On the other hand, live debugging lets the app run without stopping.
Classic debugging usually relies on setting breakpoints in the code where a program or an app stops so that a developer can observe the code and find what is causing a bug or leading to a crash.
Instead of breakpoints, live debugging uses tracepoints, also known as log points, non-breaking breakpoints, etc.
Ismail Egilmez, a seasoned business development specialist, summed up the difference like this:
In other words, tracepoints in live debugging are equivalent to breakpoints in classic debugging.
The key factor about tracepoints is that they don’t stop the execution of the program or the app that has a bug in the code.
For instance, Microsoft’s Visual Studio has the option of live debugging.
As you can see below, you can insert classing breakpoints on the specific code lines but also turn them into tracepoints by checking the Continue code execution box.
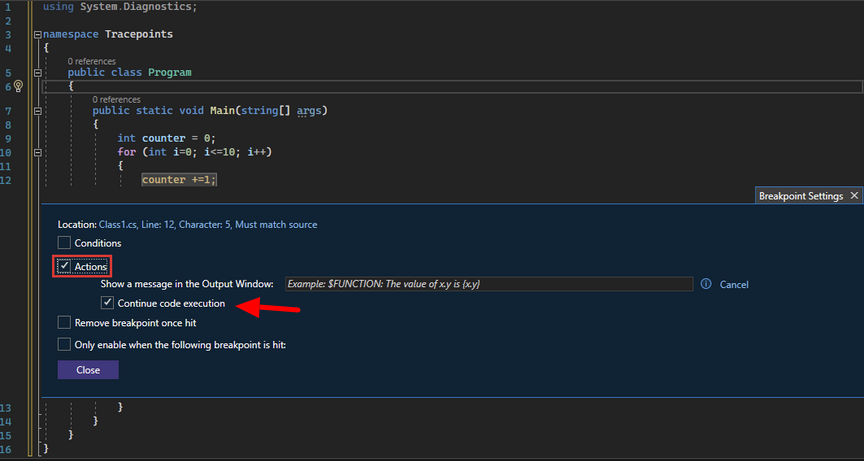
That way, the program runs without stopping at breakpoints, and a developer can observe how it behaves.
That can be vital for noticing and understanding the issue in the code since some errors can manifest only when the program is running.
Now that we’ve discussed what characterizes remote debugging and live debugging, it’s time to see the biggest differences between those debugging techniques.
Remote vs. live debugging: key differences
Remote and live debugging have some notable differences you should consider before opting for one or another.
A significant part of the differences between those methods stems from the use of breaking points in remote debugging and non-breaking breakpoints, or tracepoints, in live debugging.
When we discussed live debugging in the earlier section, we pointed out the specificity of non-breaking breakpoints—they don’t break the execution of the program.
On the other hand, breakpoints are inserted in certain code lines with the purpose of suspending the program so that a developer can analyze its performance.
For example, below, you can see a red dot next to line 16, which indicates that the program will stop running when it reaches that code line.

That difference between stopping the program in remote debugging and allowing it to run in live debugging leads to another major difference between those two debugging methods, and that’s latency.
Latency can be a significant issue with remote debugging because many factors can influence it, whether it’s the strength and stability of the network connection, the location of a cloud server, or some other unpredictable element.
For instance, this Twitter user experienced severe latency issues, so they gave up on remote debugging with VS Code.

On the other hand, latency isn’t a problem in live debugging.
You might be wondering why since we’ve mentioned earlier that live debugging is a form of remote debugging.
That’s where non-breaking breakpoints enter the picture once again.
Since the code runs uninterrupted on the remote location, live debuggers only get the snapshots of it at specific points.
The actual debugging begins after the code runs. This is how Ismail Egilmez, whom we’ve quoted earlier, explains it:
Live debuggers fetch the code, but don’t run it. Latency is eliminated from the equation here, as the debug only begins after fetching the code.
The last key difference we will mention here is syncing.
With remote debugging, you can accidentally select the wrong version of the code to debug.
For example, if the code on the server isn’t in sync with the code on the remote debugger, a developer can waste time debugging the obsolete version of the code.
On the other hand, live debuggers automatically load the copy of the latest version of the source code, so syncing is not an issue.
There are other differences between remote and live debugging, but these are some you should consider when choosing the debugging method.
Now, let’s see which method has the edge over the other.
Remote vs. live debugging: which one is better
After everything we’ve discussed in this article about remote and live debugging, it’s time to draw some conclusions about what’s better.
Both remote and live debugging are modern solutions that can save a lot of time for developers by allowing them to supervise the code and fix issues from across the globe, if necessary.
And while they are similar in that regard, if we take everything mentioned so far into account, live debugging has the advantage over remote debugging.

Very handy for handling user feedback. CTOs, devs, testers – rejoice.
Simply put, it offers everything that remote debugging does but improves upon the functionality of remote debugging by approaching the process differently.
It can collect all the necessary data for debugging with tracepoints without interrupting or stopping the program or an app, unlike classic remote debugging.
Here’s how Noa Goldman, product manager and ex-software engineer, sums up the advantages of live debugging:
It has no effect on the running application or its performance and includes a protection mechanism to make sure there are no overheads while data is being fetched.
Ultimately, whichever method you choose, it’s a convenient and modern way to debug your code.
And also, whichever debugging method you choose, it will be much more efficient if you have a tool that can help you learn about bugs and gather all the data about them before getting into fixing them.
Our own solution, Shake, is a bug and crash reporting tool that can undoubtedly be useful regardless of whether you opt for remote or live debugging.
Why? Because it’s so simple to use and yet provides so much information to developers.
When a user notices a bug in the app, all they need to do is shake the phone, and Shake will automatically create a bug report with all the data developers need to tackle the issue quickly.
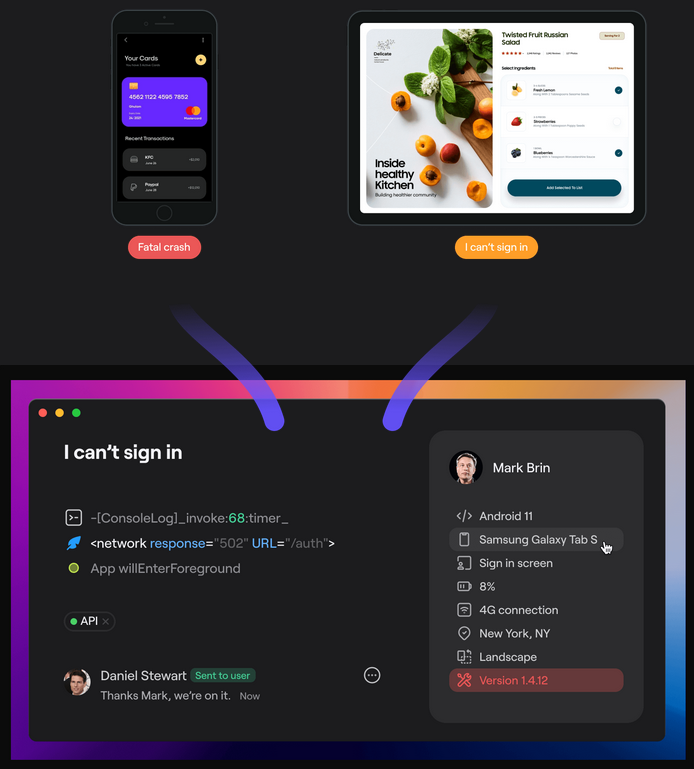
That eliminates the need for unnecessary back-and-forth with the user and speeds the process up significantly, regardless of the method you choose in the end.
Conclusion
We hope this article will help you decide what debugging method is right for you, your team, and your software development business.
Whichever it is, it will help you achieve one of the most important goals in software development—an error-free code that makes a program or an app run as intended and provides users with a great experience.
With the knowledge you now possess, you should be able to make the right choice to debug your code.

