
Logging is perhaps one of the most critical aspects of software development.
It’s your window to what’s happening in your application behind the scenes. It allows you to monitor the status to ensure everything is okay and alerts you to any potential issues so you can tackle them ASAP.
But if not done properly, app logging will quickly turn from your best advantage to your biggest nightmare.
Logging best practices will certainly help. But you must also be aware of—and avoid—the seven most common app logging mistakes.
Table of Contents
Not updating your log management strategy
Effective app logging starts with proper log management that’s well-adapted to your software’s changing needs and requirements.
Unfortunately, many teams don’t update their log management often enough. They rely on what they’ve used in the beginning, even if it’s not suitable anymore for the circumstances at hand.
This impacts app logging negatively. At best, it causes you to spend unnecessary time and money on your logging processes.
To get around this, it’s critical to continuously evaluate your current logging strategy and update it as needed.
For example, app stability might become a key metric as your application grows. But if you don’t update your log management to track them, you might be missing out on some important metrics.
Another example is failing to update your incident response policies. Not doing this will make you more vulnerable to attacks and slower to recover because you won’t know what’s coming.
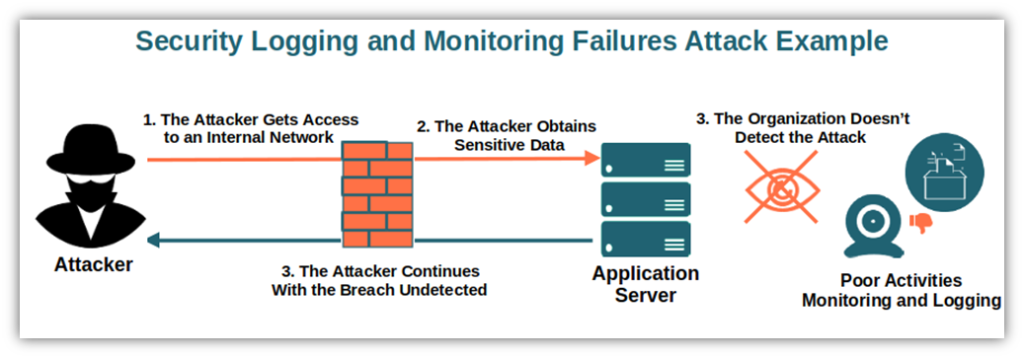
Say your app recently encountered a new malware. A good approach is to update your policies to monitor the logs for evidence of that attack. That way, you can prevent such an event from happening again.
But more importantly, your log management should adhere to current laws and regulations.
Data privacy regulations such as GDPR have strict data handling and protection rules that change over time.
Not adapting to these quickly enough can make you susceptible to security flaws or, worse, open you up to fines and penalties from regulators.
It’s important to remember that your log management strategy is never set in stone. Like everything else in app development, it should be fluid enough to adapt quickly.
Using inadequate tools for app logging
App logging, at its most effective, should be as automated as possible.
Collecting data should never get in the way of your app’s performance. And it must not waste too much of your team’s time and resources.
The best way to do this is by using the right logging tools. Using subpar or inadequate solutions can make troubleshooting and debugging your app much more difficult than it needs to be.
For instance, most developers still rely on receiving feedback and crash reports from users.
Unfortunately, this is tedious and time-consuming for most people, so they might not do it. Or they might provide insufficient data that makes identifying the problem challenging.

Automated tools like Shake can help solve this problem.
Shake will capture all the relevant details regarding the circumstances at the time of a bug or crash, such as device state, OS version, and memory.
That way, you can rest assured that you’re getting a clear picture of the issue so you can recreate and fix it.
Best of all, there’s minimal hassle to the user, so their experience isn’t disrupted.

Get unreal data to fix real issues in your app & web.
Analysis and visualization platforms are also important to consider.
By default, apps generate individual log records stored on a server. But to extract any useful insight from them, you need to collate and evaluate them. This allows you to spot patterns in the data.
As you can imagine, doing this manually is a big pain and wastes time. But automated tools can do this for you.
The bottom line is that you must invest in serious tools for your logs. Only then can you maximize their full benefits.
Choosing not to collect certain app logs
A common mistake among developers and administrators is failing to collect enough types of app logs.
The fact is that different logs exist for a reason—they tell you how well certain aspects of your app are doing. Neglecting to record these can result in blind spots and a lack of context for more severe issues in the future.
To avoid this, you need to ensure you’re collecting all seven crucial log types listed below:
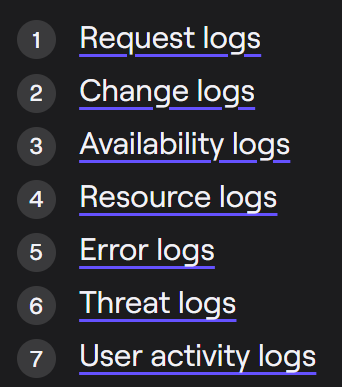
Request logs are arguably the most important. They capture every time the user interacts with the app, whether it’s logging in to their account or updating something on the database.
These provide general purpose but valuable insights. For instance, you can use it to identify suspicious behavior (such as multiple failed login attempts) that could be a preface to a breach.
Another is resource logs, which track your app’s resource usage. For instance, you can check how much memory it’s consuming.
Resource logs are great for monitoring your app’s performance. They can also alert you to an impending crash (such as if your network bandwidth is close to being congested) so you can do something about it.
But, one critical log that many people don’t prioritize enough is the threat log.
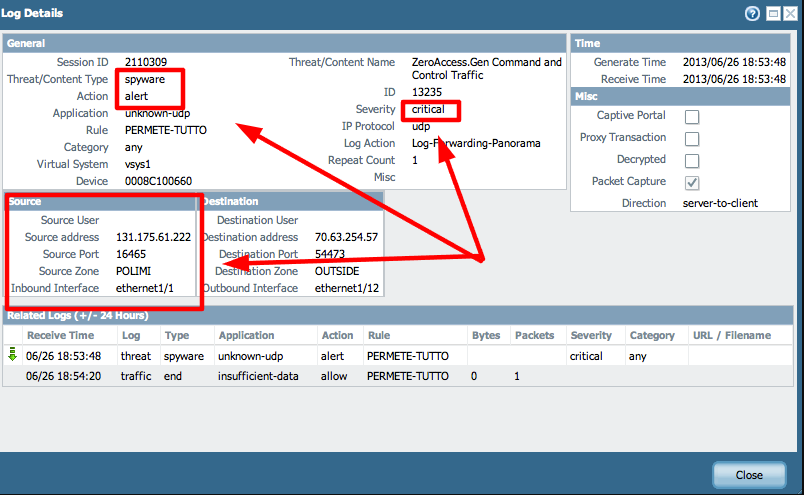
Threat logs are essential to protect your app from breaches and hacks. It gives you a snapshot of the system at the time of the attack, giving you the intel to prevent it from happening in the future.
The bottom line is that collecting enough types of logs is essential if you want to capture the whole picture of your application.
But be warned—there is such a thing as collecting too many logs. We’ll talk about that next.
Collecting an overwhelming number of logs
Collecting every log your app generates might seem like the simplest and the most cost-effective approach. However, overdoing it can be just as detrimental to your app as not collecting enough.
An overwhelming number of logs will take up excessive storage space from your app, eventually leading to a negative performance.
Plus, writing these logs takes up system time and resources, which could slow down everything when generated in volume.
Liran Mendelovich, a Cisco employee, found that removing excessive logging in his system freed up to 70 GB of memory and sped up processing time from 1 minute to 25 seconds.
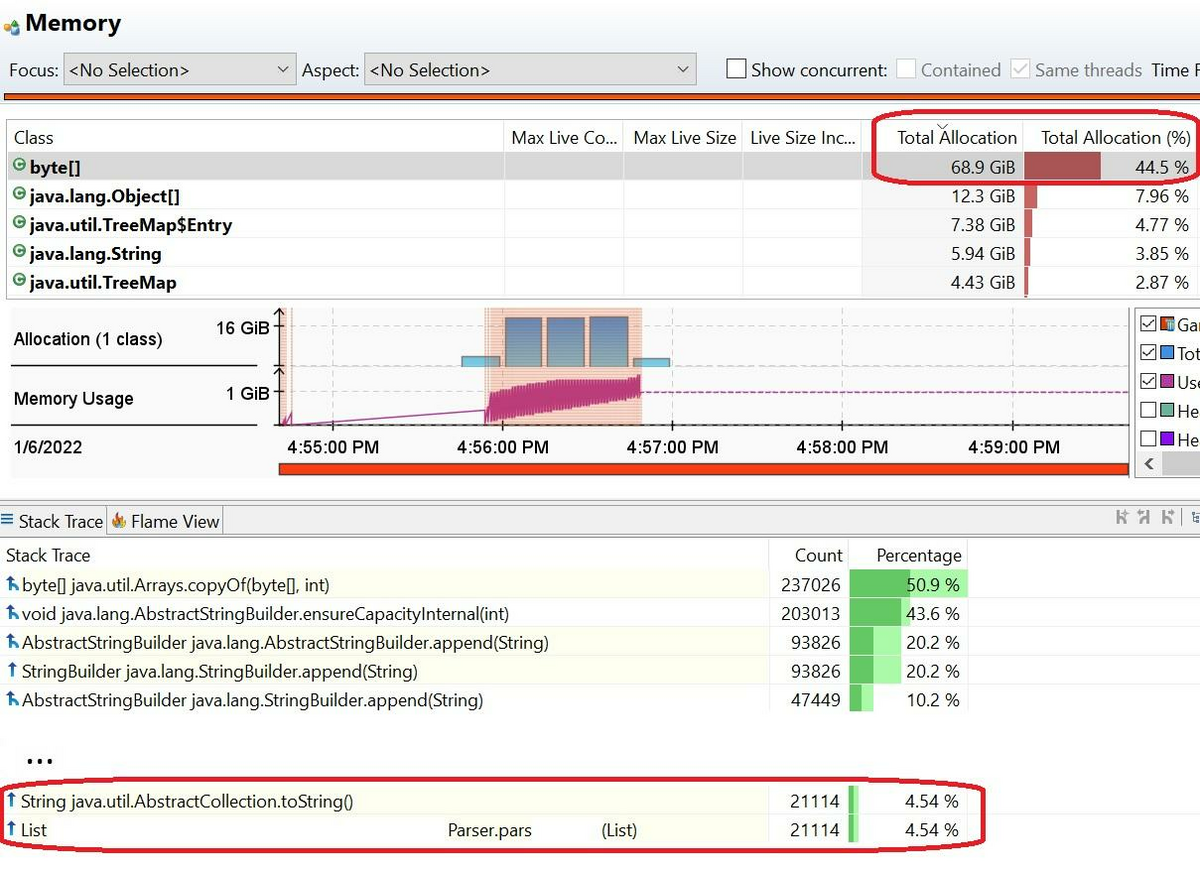
In addition, too many logs are a pain to deal with. You’ll spend unnecessary time and effort trying to find useful insights from your logs. This will stretch debugging and troubleshooting tremendously.
The best way to get around this is to regulate your logs through app logging levels.
Basically, a log level is a classification system that assigns tiers to your logs, with more severe, mission-critical items getting the highest levels. This allows you to prioritize logs quickly.
You can also set your app only to generate logs on a specific logging level, then ignore the rest. This allows you to capture only essential items while reducing your log volume.
For instance, administrators can safely ignore Trace or Debug logs, as those contain information only relevant to developers.
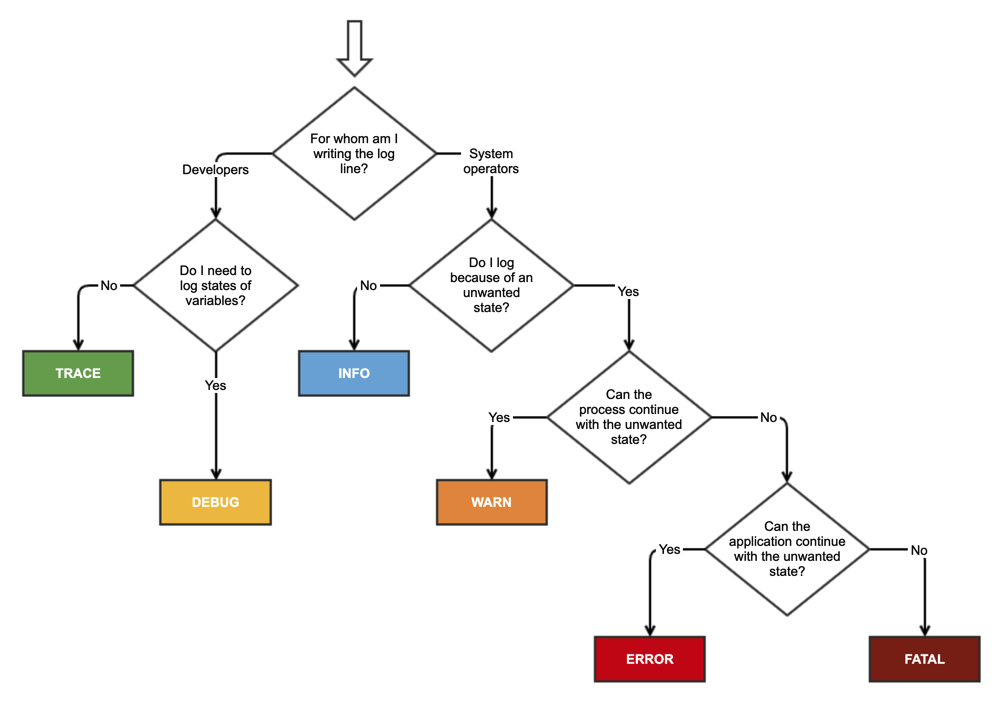
But this will only work if you have the proper log levels in the first place, which is where many app teams stumble.
Not being careful when setting log levels
Setting log levels haphazardly can be dangerous.
It could generate too much data in your log file, making diagnosing issues difficult. Conversely, levels that generate too little data are also detrimental, as they lack useful insights.
Thus, it’s important to be strategic when approaching this task.
Fortunately, most logging systems follow the System Logging Protocol (Syslog). This provides a set of five logging levels as a standard, with guidelines on assigning each. Here they are:
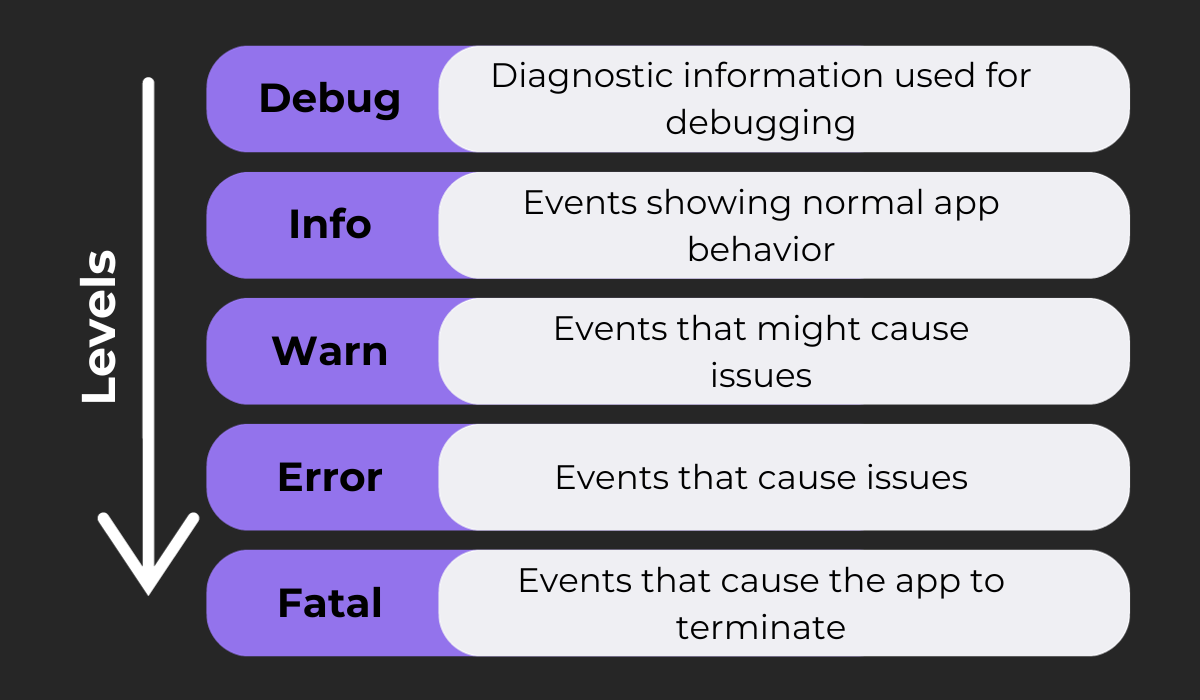
Following these standards is a good way to ensure you use appropriate levels.
For instance, if your app is still in development, you’ll want to capture every Debug log as possible. These include data that facilitates coding and testing.
However, debug logs are often long and extensive, so they consume a lot of space. They could also contain sensitive information about your app that a hacker could exploit.
Thus, once your app launches, don’t forget to turn off debug logs.

Very handy for handling user feedback. CTOs, devs, testers – rejoice.
You can also create custom levels to further fine-tune your logging.
For instance, you could create a security level that captures threat logs exclusively, making it easy for your cybersecurity team to monitor app security.
Or, you can generate levels for specific components so the relevant teams can quickly find them.
However, you must be careful not to create too many levels, as that could make dealing with your logs cumbersome.
Failing to provide enough context for each log
Logs are meant to provide as much information about an event or error as possible. So, if your logs lack enough context, deciphering it would be next to impossible.
That makes it almost worthless for debugging and troubleshooting.
For instance, consider the error log Cannot connect to server. On its own, it tells you there’s an error but not why it happened. There’s no context.
The result? You’ll waste time trying to guess what caused the error. That’s precious time that could’ve been spent fixing it.
Thus, your log entries must contain as much relevant information as possible.
As an example, consider the reports that Shake sends to developers. Notice that it captures all the essential info that gives you a clear idea of the root cause.
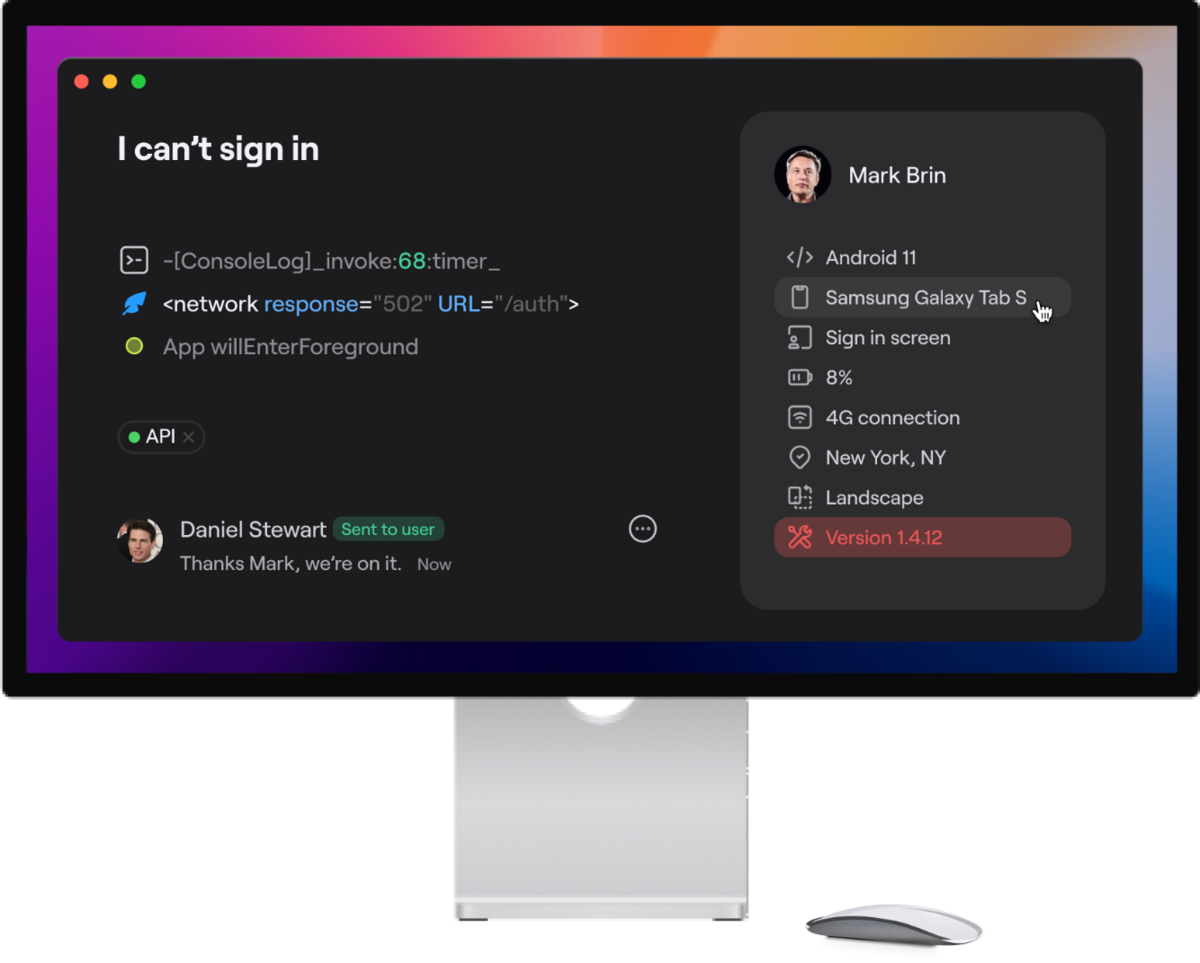
But at the same time, you should still keep your logs short. Remember, if they contain too much information, they can consume too much storage space, which hampers app performance.
One way to make concise but contextual logs is to use code and shorthand to shorten information. It’s the best way to communicate everything while maximizing space.
Here’s an example:

Admittedly, striking this balance of conciseness and relevance can be tricky. But finding that sweet spot is possible if you fully understand your app and know which data are important.
Having inefficient log retention practices
Setting how long the system keeps the logs is an overlooked yet critical consideration.
If you delete your logs too early, you could throw away important insights that could benefit your app immensely.
Conversely, if you keep them forever, you’re letting useless logs consume unnecessary storage space.
To walk this very fine line, you’ll need a log retention policy.
A log retention policy basically defines what log files should be deleted and when.
For example, here’s the log retention policy of the University of Buffalo IT team:
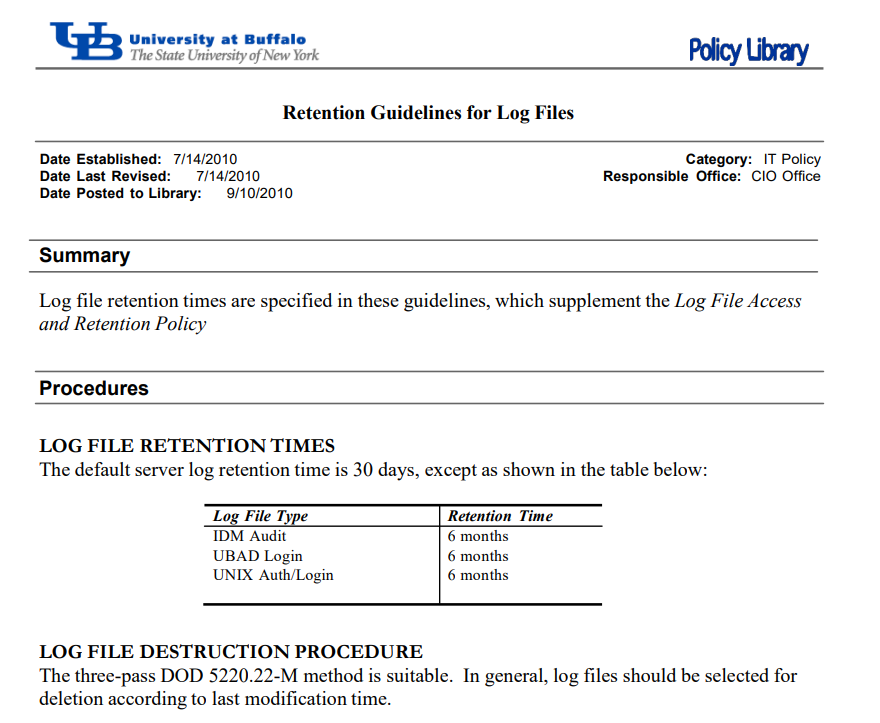
Log retention is normally set in days, with a default of 30 days. But some critical items, like in the example above, are kept longer.
Figuring out which important logs to exempt is a part of log retention planning.
Alternatively, you can create a log retention policy based on storage space.

For instance, you can instruct your logging system to start deleting logs (starting with the oldest entries) once it exceeds 5 GB. Or, you can begin purging if your available space is less than 20%.
Also, note that there are some log entries that the law prevents you from deleting. Usually, these include security and data privacy files for compliance purposes. Ensure your retention policy accounts for these and doesn’t delete them by mistake.
The best way to optimize your app logging process
There you have it—the seven app logging mistakes you should avoid.
If you’ve made a few of these mistakes, don’t worry too much. They’re fairly common and, thus, easy to commit.
But after reading this article, we hope you’re armed with the knowledge to avoid them entirely and optimize your logging process.
And, while you’re at it, don’t forget to check our article on the nine helpful tips for effective app logging.


